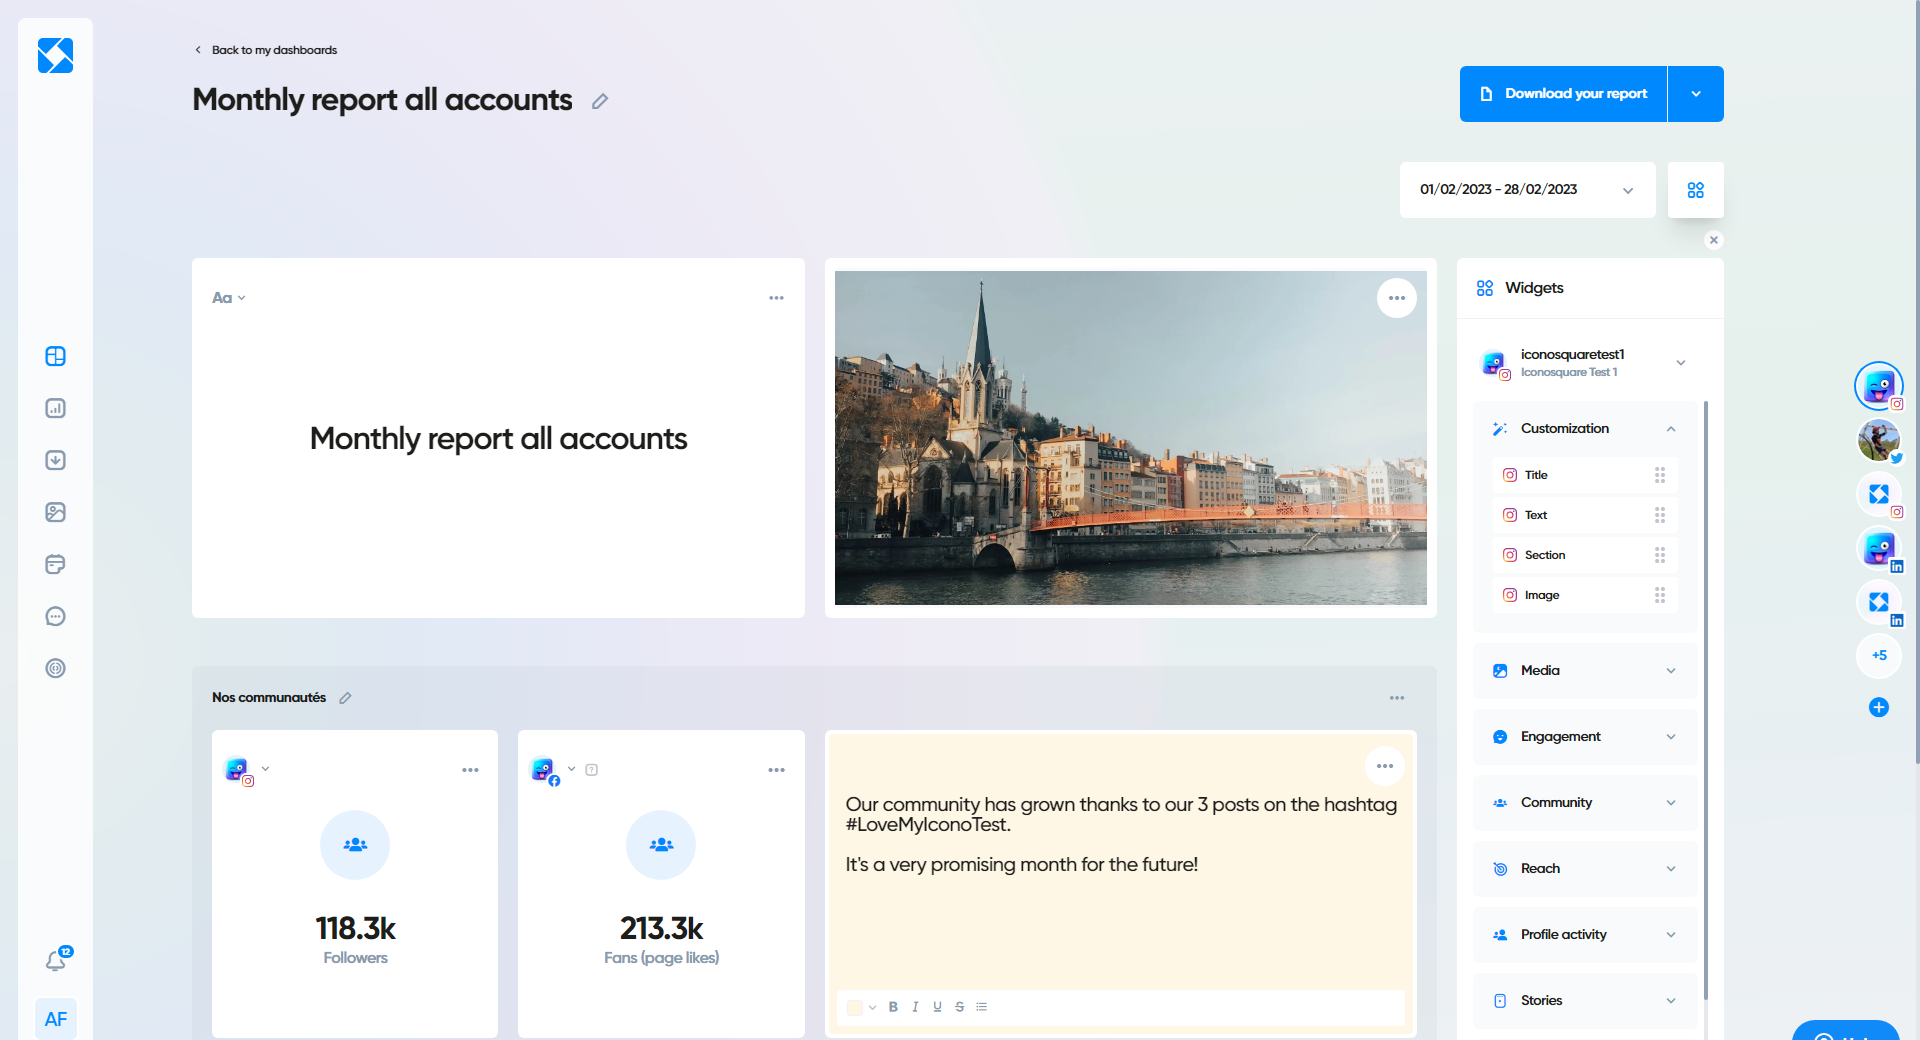
Where can I find these widgets?
The Title, Text, Image, and Section widgets are available in the widget menu, in a dropdown menu above the others, called “Customization”.
To add them, follow the steps below.
- Go to your dashboard
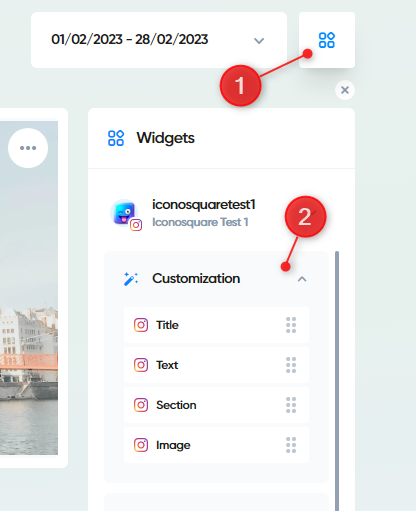
- Open the widget menu by clicking on the square icon in the top right corner of your screen, to the right of the period selector.
- Look for and open the dropdown menu called “Customization”.
- Drag and drop the widget of your choice into your dashboard.
The Title and Text widgets are respectively used to organize your dashboard and provide written context to your results, for example when you cannot do so orally.
First, find these widgets in the "Customization" dropdown menu in the Widgets lateral menu, then drag and drop them into your dashboard by dragging and dropping .
To add or modify text in these widgets, click on them, then start typing your text.
To resize the text, the Title widget offers you an Aa menu in the top left corner. The Text widget adapts to the number of characters displayed, allowing you to use short descriptions or long justifications!
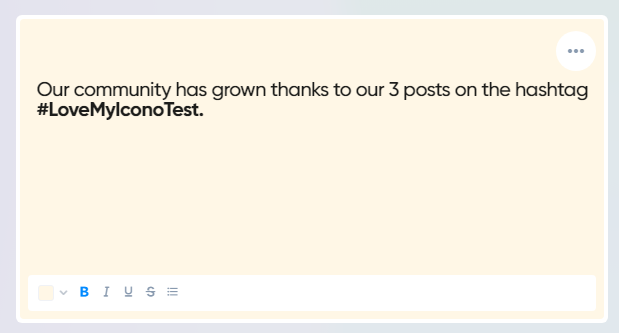
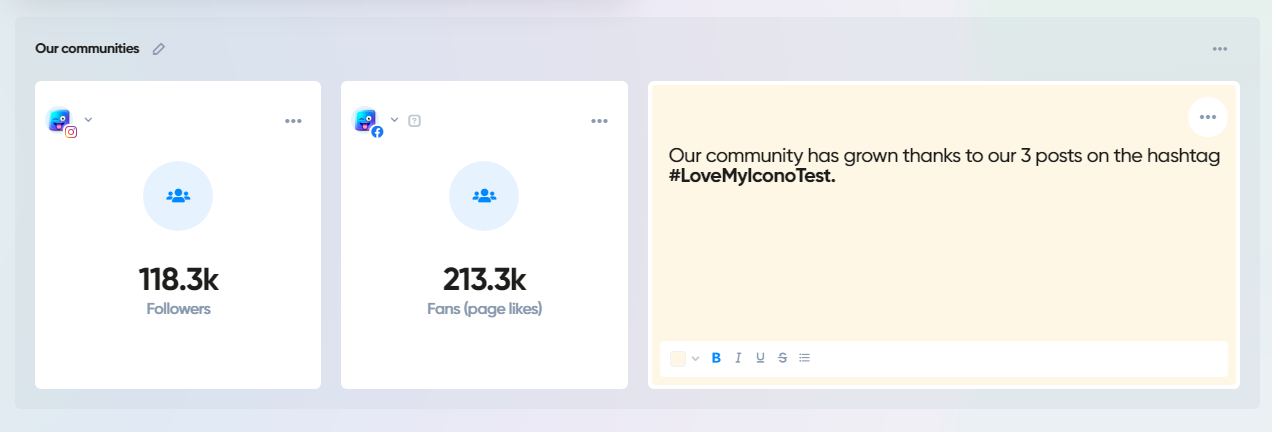
Moreover, you can adjust the text formatting for the Text widget. Simply select your text to make it bold, italic, underline, strikethrough, or turn it into a bulleted list.
Finally, it is possible to change the background color of the Text widget. Simple white or colorful like a post-it, the choice is yours! Click on the colored square in the bottom left of the formatting bar, and use the color picker to change the background.
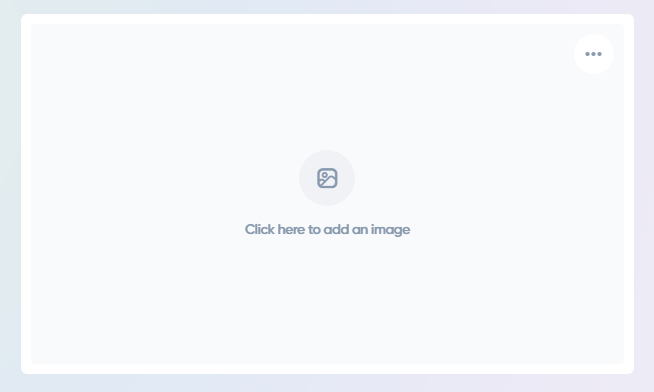
The Image widget allows you to illustrate your dashboard with your best publications, or to add screenshots from other software to your presentation.
Find the widget in the "Customization" dropdown menu and add it to your dashboard by dragging and dropping it. Then click on it to select an image to add to your dashboard. You can then change the image using the “…” menu and then Change image.
Image specifications:
Min Width: 340px / Min Height: 340px
Max weight: 2MB
Formats: jpg, jpeg, png
The Section widget allows you to group several widgets together. You can use it to bring together multiple data about the same profile, or to compare similar analytics.
The section will be particularly useful for your PDF exports because widgets in the same section will be displayed on the same page.
To use a section widget, drag and drop the section widget from the Widgets lateral menu to your dashboard, then repeat the operation with the widgets you want to add to the section.
You can then name your section using the pencil icon in the top left corner, or even move the section with all its widgets by dragging it with your cursor.
Yes, in the form of a PDF export! The widgets will be displayed on your presentation.
The sections will even be displayed on a dedicated page, to highlight some of your data.
How to go further in customization?You can use the Report Customization feature to add cover pages, additional titles, change colors, or add their logo to their report.
To learn more about this feature, click here.